Candlestick Patterns in Crypto Trading
In the fast-moving world of cryptocurrency trading, understanding candlestick patterns is crucial for making informed decisions. Whether you’re a beginner or an experienced trader, recognizing bullish and bearish signals can help you predict market trends, find optimal entry and exit points, and improve your overall trading strategy.
Candlestick patterns provide a visual representation of price action, revealing market sentiment and potential trend reversals. In this comprehensive guide, we’ll break down what candlestick patterns are, how to read them, and how to use them to spot bullish and bearish signals in crypto trading.
What Are Candlestick Patterns?
A candlestick pattern is a form of technical analysis that represents price movements over a specific time frame. Each candlestick shows four key pieces of information:✔ Open price – The price at the start of the time frame.
✔ Close price – The price at the end of the time frame.
✔ High price – The highest price reached.
✔ Low price – The lowest price reached.
The body of the candlestick represents the opening and closing prices, while the wicks (or shadows) show the highest and lowest points.
📌 Bullish Candlesticks (Green/White) → Closing price is higher than opening price.
📌 Bearish Candlesticks (Red/Black) → Closing price is lower than opening price.
Candlestick formations help traders identify potential reversals, breakouts, and continuation patterns in the market.
How to Read Candlestick Patterns?
Before diving into specific patterns, let’s break down the structure of a candlestick:
- Long body → Strong buying or selling pressure.
- Short body → Weak buying or selling pressure.
- Long upper wick → Sellers pushed the price down after a rally.
- Long lower wick → Buyers pushed the price up after a drop.
Understanding these signals is essential for predicting market movements.
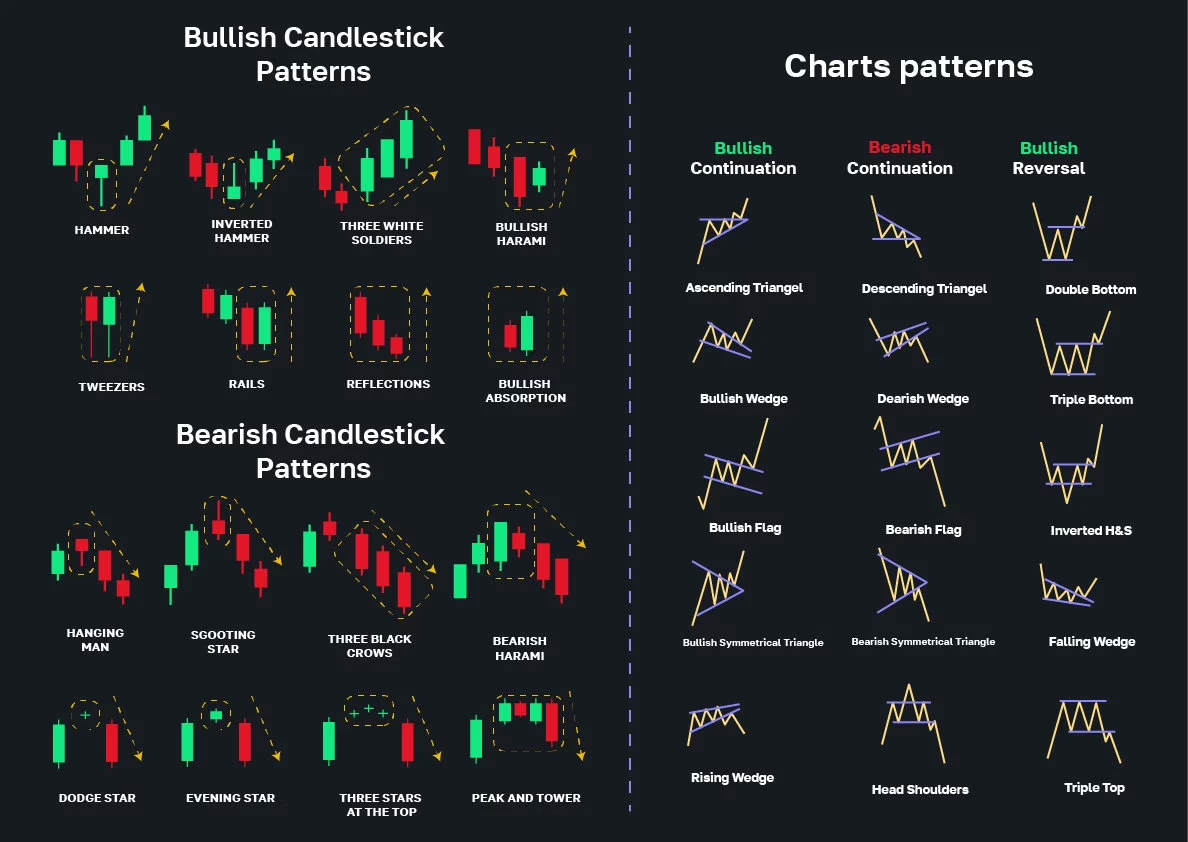
Bullish Candlestick Patterns: Buy Signals
Bullish candlestick patterns indicate a potential price increase, signaling a good entry point for long trades.
1. Hammer 🛠️
📈 What it means: A hammer signals a bullish reversal after a downtrend. It indicates that buyers are gaining strength.
✔ Small body at the top with a long lower wick.
✔ The lower wick should be at least twice the size of the body.
✔ Appears at the bottom of a downtrend.
💡 Trading Tip:
- Look for confirmation with a green candle after the hammer.
- Works best with volume increase.
2. Bullish Engulfing
📈 What it means: A large green candle completely engulfs the previous red candle, showing strong buying pressure.
✔ Happens at the end of a downtrend.
✔ The green candle must be larger than the previous red candle.
💡 Trading Tip:
- Enter a long trade after the engulfing pattern, ideally with high volume.
- Works best when near support levels.
3. Morning Star 🌟
📈 What it means: A three-candle pattern that signals a bullish reversal.
✔ First candle → Large red (bearish).
✔ Second candle → Small-bodied (indecision).
✔ Third candle → Large green (bullish).
💡 Trading Tip:
- Look for a strong green candle closing above the midpoint of the first red candle.
- Higher trading volume confirms the signal.
4. Three White Soldiers ⚔️
📈 What it means: Three consecutive strong green candles indicate a strong uptrend.
✔ Each candle opens higher than the previous close.
✔ No long upper wicks (shows strong buying momentum).
💡 Trading Tip:
- This pattern is a strong buy signal, especially after a downtrend.
- Combine with RSI or moving averages for confirmation.
Bearish Candlestick Patterns: Sell Signals
Bearish candlestick patterns indicate a potential price drop, signaling a good exit or short trade opportunity.
1. Shooting Star 🌠
📉 What it means: A shooting star signals a bearish reversal after an uptrend.
✔ Small body at the bottom with a long upper wick.
✔ The upper wick should be at least twice the size of the body.
✔ Appears at the top of an uptrend.
💡 Trading Tip:
- Look for confirmation with a red candle after the shooting star.
- Works best with a resistance level.
2. Bearish Engulfing
📉 What it means: A large red candle completely engulfs the previous green candle, showing strong selling pressure.
✔ Happens at the end of an uptrend.
✔ The red candle must be larger than the previous green candle.
💡 Trading Tip:
- Enter a short trade after the engulfing pattern.
- Works best when near resistance levels.
3. Evening Star 🌅
📉 What it means: A three-candle pattern that signals a bearish reversal.
✔ First candle → Large green (bullish).
✔ Second candle → Small-bodied (indecision).
✔ Third candle → Large red (bearish).
💡 Trading Tip:
- Look for a strong red candle closing below the midpoint of the first green candle.
- Higher trading volume confirms the signal.
4. Three Black Crows 🦅
📉 What it means: Three consecutive strong red candles indicate a strong downtrend.
✔ Each candle opens lower than the previous close.
✔ No long lower wicks (shows strong selling momentum).
💡 Trading Tip:
- This pattern is a strong sell signal, especially after an uptrend.
- Combine with RSI or moving averages for confirmation.
How to Use Candlestick Patterns in Crypto Trading?
Here’s how you can integrate candlestick patterns into your trading strategy:
1. Combine with Technical Indicators
📌 Moving Averages → Use 50-day & 200-day MA to confirm trends.
📌 Relative Strength Index (RSI) → Check for overbought (>70) or oversold (<30) conditions.
📌 MACD → Look for bullish/bearish crossovers.
2. Look for Confirmation Signals
✔ Always wait for the next candle to confirm a pattern before entering a trade.
✔ Check trading volume—high volume increases reliability.
3. Identify Key Support and Resistance Levels
✔ Use support levels for bullish patterns.
✔ Use resistance levels for bearish patterns.
Final Thoughts
Candlestick patterns are a powerful tool for crypto traders. They help in spotting bullish and bearish signals, identifying trend reversals, and making more informed trading decisions.
🚀 Key Takeaways:
✅ Learn to read candlestick structures.
✅ Use bullish patterns to enter trades.
✅ Use bearish patterns to exit or short trades.
✅ Combine with technical indicators for accuracy.
By mastering candlestick patterns, you’ll gain a valuable edge in the crypto market. Start applying these strategies today and take your trading skills to the next level!
💬 Do you use candlestick patterns in your crypto trading? Share your experiences in the comments below! 🚀