How to Read Charts Like a Pro
Cryptocurrency trading has taken the financial world by storm, offering lucrative opportunities for investors. However, with high volatility comes great risk. To navigate the crypto market successfully, traders must understand technical analysis (TA)—a powerful method used to analyze price movements, trends, and potential future market behavior.
Whether you’re a beginner or an experienced investor, mastering technical analysis will help you make informed trading decisions, identify entry and exit points, and maximize profits.
In this ultimate guide, we will cover everything you need to know about crypto technical analysis, from reading charts and indicators to trading strategies and risk management.
What is Crypto Technical Analysis?
Technical Analysis (TA) is a trading method used to analyze past market data—mainly price and volume—to predict future price movements. Unlike fundamental analysis, which looks at the intrinsic value of an asset, technical analysis focuses on price action, market psychology, and historical trends.
Technical analysis assumes:
✅ Price movements follow trends – Markets move in trends rather than random fluctuations.
✅ History repeats itself – Market patterns tend to recur over time due to trader psychology.
✅ Market prices reflect all information – Current price action incorporates all known data.
By applying chart patterns, indicators, and trading strategies, traders can develop an edge in the market and improve their chances of success.
Understanding Crypto Charts
The foundation of technical analysis lies in reading and interpreting price charts. Let’s break down the key components of a crypto chart:
1. Types of Crypto Charts
🔹 Line Chart – A simple chart that connects closing prices over time. Best for spotting long-term trends.
🔹 Bar Chart – Displays open, high, low, and close (OHLC) prices for each time period.
🔹 Candlestick Chart – The most popular type among traders, showing price action through candlestick patterns.
Example of a Candlestick:
- Green (Bullish) – The price closed higher than it opened.
- Red (Bearish) – The price closed lower than it opened.
- Wick (Shadow) – Represents the highest and lowest prices during the period.
Key Technical Indicators for Crypto Trading
Indicators are mathematical calculations that help traders analyze price trends and momentum. Here are the most important ones:
1. Moving Averages (MA)
Moving averages smooth out price data to identify trends.
📌 Simple Moving Average (SMA) – Calculates the average price over a specific period.
📌 Exponential Moving Average (EMA) – Puts more weight on recent prices for faster trend detection.
📊 How to use it?
- Golden Cross (Bullish) – When the 50-day MA crosses above the 200-day MA.
- Death Cross (Bearish) – When the 50-day MA crosses below the 200-day MA.
2. Relative Strength Index (RSI)
The RSI measures the strength of price movements on a scale from 0 to 100.
✅ Above 70 – Overbought (Potential Sell Signal)
✅ Below 30 – Oversold (Potential Buy Signal)
3. Bollinger Bands
Bollinger Bands consist of a middle moving average line and two bands above and below.
✔ When prices touch the upper band, the asset may be overbought.
✔ When prices touch the lower band, the asset may be oversold.
4. MACD (Moving Average Convergence Divergence)
MACD is a trend-following indicator that signals momentum shifts.
✔ MACD Line crossing above the Signal Line – Bullish
✔ MACD Line crossing below the Signal Line – Bearish
5. Volume
Volume represents the number of trades during a period.
✔ High volume with price increase = Strong Uptrend
✔ High volume with price decrease = Strong Downtrend
Popular Candlestick Patterns & What They Mean
Candlestick patterns provide visual insights into market trends. Here are some key patterns:
Bullish Patterns (Indicate Price May Go Up)
✅ Hammer – A small body with a long lower wick, indicating a potential reversal.
✅ Bullish Engulfing – A large green candle fully engulfs the previous red candle.
✅ Morning Star – A three-candle pattern signaling a trend reversal.
Bearish Patterns (Indicate Price May Go Down)
❌ Shooting Star – A small body with a long upper wick, indicating a possible downtrend.
❌ Bearish Engulfing – A large red candle engulfs the previous green candle.
❌ Evening Star – A three-candle pattern signaling a downward reversal.
Crypto Trading Strategies Using Technical Analysis
1. Trend Following Strategy
Traders use moving averages and trendlines to follow the trend.
✔ Buy when price is above the 50-day and 200-day MA.
❌ Sell when price falls below these moving averages.
2. Breakout Trading Strategy
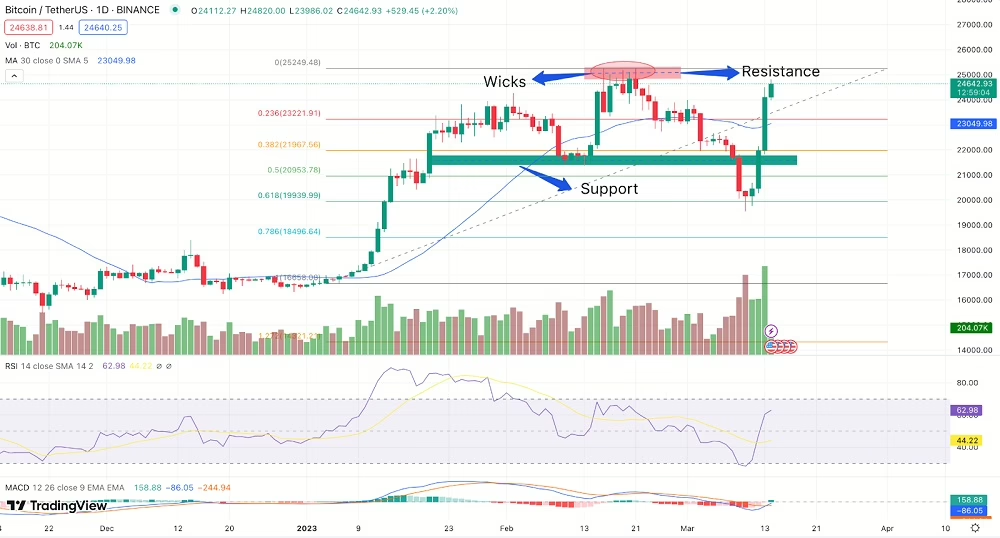
Traders look for key support and resistance levels and enter trades when price breaks through.
✔ Buy if price breaks above resistance with high volume.
❌ Sell if price breaks below support.
3. RSI Overbought/Oversold Strategy
✔ Buy when RSI is below 30 (oversold).
❌ Sell when RSI is above 70 (overbought).
4. Scalping Strategy
A short-term strategy where traders buy and sell quickly to capture small profits multiple times a day.
✔ Use low time frames (1-minute to 5-minute charts).
✔ Look for quick price movements with high volume.
5. MACD Crossover Strategy
✔ Buy when the MACD Line crosses above the Signal Line.
❌ Sell when the MACD Line crosses below the Signal Line.
Risk Management: Protecting Your Capital
Technical analysis helps traders maximize profits, but risk management ensures capital preservation. Here’s how:
1. Set Stop-Loss & Take-Profit Orders
✔ Stop-Loss – A price level at which you exit to limit losses.
✔ Take-Profit – A price level at which you exit to secure gains.
2. Risk-Reward Ratio (RRR)
✔ A 1:2 ratio means risking $100 to gain $200.
✔ Always aim for a higher reward than your risk.
3. Position Sizing
✔ Never risk more than 1-2% of your total capital per trade.
✔ Adjust position sizes based on market volatility.
4. Emotional Discipline
✔ Avoid FOMO (Fear of Missing Out).
✔ Follow your trading plan, not emotions.
Final Thoughts: Mastering Crypto Technical Analysis
Crypto technical analysis is a powerful tool that allows traders to identify trends, predict price movements, and make informed trading decisions.
🚀 Key Takeaways:
✅ Learn to read charts and indicators like a pro.
✅ Use technical patterns and strategies for better trade entries/exits.
✅ Implement risk management to protect capital.
With practice and discipline, technical analysis can give you an edge in the crypto market. Start applying these concepts today and take your crypto trading skills to the next level!
💬 Do you use technical analysis for crypto trading? What’s your favorite strategy? Share your thoughts in the comments! 🚀